
 日本語
日本語 Vietnamese
MONITORING API USING AMAZON CLOUDWATCH SYNTHETICS CANARIES
Introduction
AWS CloudWatch
As a service to help monitor, aggregate, and analyze data, resources running on AWS. This service helps to provide practical information in real-time, allowing monitoring of memory areas of applications, infrastructure, and services such as Ram, Disk,…
and use alerts; help optimize application performance, manage resource usage, and understand the health of your entire system, AWS resources, and customer applications running on Amazon’s infrastructure.
AWS Canary
Created from Amazon CloudWatch Synthetics for monitoring your endpoints and APIs. Canaries are programmable scripts that follow a route and perform the same actions as a customer, which makes it possible to continuously verify your customer experience even when you don’t have any customer traffic on your applications. By using canaries, you can discover issues before your customers do. Canaries can be set to run on a set schedule.
Canaries are scripts written in Node.js or Python. Canaries work over both HTTP and HTTPS protocols.
Canaries check the availability and latency of your endpoints and can store load time data and screenshots of the UI. They monitor your REST APIs, URLs, and website content, and they can check for unauthorized changes from phishing, code injection and cross-site scripting.
Steps to create a Canary
Step 1: Open the CloudWatch console at https://console.aws.amazon.com/cloudwatch/
Step 2: In the navigation pane, choose Application monitoring -> Synthetics Canaries. Then choose Create Canary.

Step 3:

Choose one of the following ways:
1. Choose “Use a blueprint“: Use the built-in template scripts
2. Choose “Inline Editor“: To upload your Node.js script to create a custom canary
3. Choose “Import from S3“: To import your script from the S3 bucket
Note: This way, you must have s3:GetObject and s3:GetObjectVersion permissions for the S3 bucket you use.
In this article, I will use the “Use a blueprint” option.
Step 4: After selecting “Use a blueprint” you will see the available template scripts below:

Heartbeat monitoring:
Heartbeat scripts load the specified URL and store a screenshot of the page and an HTTP archive file (HAR file). They also store logs of accessed URLs.
You can use the HAR files to view detailed performance data about the web pages.
You can analyze the list of web requests and catch performance issues such as time to load for an item.
API canary:
Can test the basic Read and Write functions of a REST API.
Can work with any APIs and test all types of functionality. Each canary can make multiple API calls.
Broken Link Checker:
Collects all the links inside the URL that you are testing.
Detects the following types of link errors:
• 404 Page Not Found, Bad URL
• Invalid Host Name
• Invalid HTTP response code
• The HTTP requests constantly time out during the canary’s run
• The host consistently drops connections because it is misconfigured or is too busy
• The host server returns empty responses with no content and no response code
Canary Recorder:
With the canary recorder blueprint, you can use the CloudWatch Synthetics Recorder to record your click and type actions on a website and automatically generate a Node.js script that can be used to create a canary that follows the same steps. The CloudWatch Synthetics Recorder is a Google Chrome extension provided by Amazon.
GUI workflow builder:
The GUI Workflow Builder blueprint verifies that actions can be taken on your webpage.
Visual monitoring:
The visual monitoring blueprint includes code to compare screenshots taken during a canary run with screenshots taken during a baseline canary run. If the discrepancy between the two screenshots is beyond a threshold percentage, the canary fails.
In this article, I will use the “API canary” option.
Step 5: Name your canary, here I name it canary-api.

Step 6: Add API HTTP request.

This API HTTP request detail includes: Method, endpoint URL, Request Data, and Headers. After filling in this information, you will put a name in the Step name and click Save.

Step 7: If you are using environment variables in your script, choose Environment variables and then specify a value for each environment variable defined in your script.

Step 8: At Schedule you can choose the frequency for the canary runs, there are 3 options:

• Run continuously: run often
• CRON expression: run based on the expression CRON
• Run once: run once
Next, you choose the runtime for each canary. Here I choose Run continuously and run every 20 minutes.
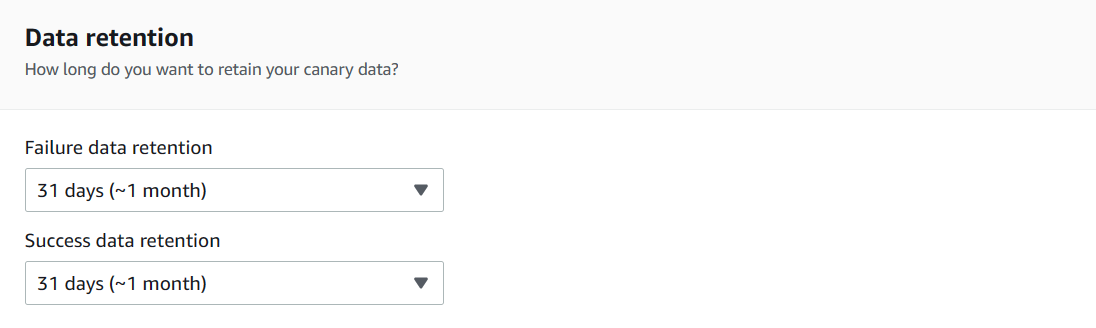
Step 9: At Data retention you can set how long to store your canary data. The default is 31 days.
Step 10: In Data Storage, this section is where the results of each canary run are stored. In s3 the default location will be pre-populated when you create a canary or you can choose an existing S3 to change.

Step 11: At Access permissions you can select an existing role or create a new role automatically by Synthetics to execute the canary.

Step 12: Leave the rest of the parameters at default and click “Create canary“. The API canary may take a minute or two to construct.

Step 13: After successfully creating the canary the interface will look like this.

Create a group for Canary
Step 1: Open the CloudWatch console at https://console.aws.amazon.com/cloudwatch/
Step 2: In the navigation pane, choose Application monitoring -> Synthetics Canaries. Then choose Create Group.

Step 3: Enter the group name.

Step 4: Search for the exact canary name and select to add to the group. Then press Create Group

Step 5: After creating a successful group, you will see that the canary you selected in the above step will be in the group to make it easier to manage the canary.

View Canary stats and details
To view details about the canary, click on the corresponding canary name

Tab Availability: Will display information about the recent runs of this canary. Includes: Statistics of canary timelines running successfully or failing, as well as problems with errors as shown in the image below.

You can click Download artifacts to download the file and can view the detailed canary results after running.

Tab Monitoring: Show a graph of CloudWatch metrics published by this canary. For more information on these indicators refer to: https://docs.aws.amazon.com/AmazonCloudWatch/latest/monitoring/CloudWatch_Synthetics_Canaries_metrics.html

Tab Configuration: Displays configuration and schedule information about the canary.
Tab Groups: Displays the groups that this canary is associated.
Tab Tags: Displays the tags associated with the canary.
Conclusion
Use Amazon CloudWatch Synthetics to create canary to make monitoring your application’s endpoints easier. You can continuously validate the user experience, even when there is no customer traffic to the application. This allows you to spot problems in front of your customers and make for the best user experience.
References
https://docs.aws.amazon.com/AmazonCloudWatch/latest/monitoring/CloudWatch_Synthetics_Canaries.html
https://dev.to/aws-builders/synthetic-monitoring-using-aws-canaries-cloudwatch-12jb